
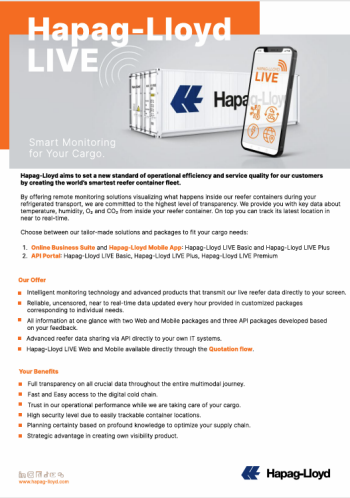
Hapag-Lloyd aims to set a new standard of operational efficiency and service quality for our customers by creating the world’s smartest reefer container fleet.
By offering remote monitoring solutions visualizing what happens inside our reefer containers during your refrigerated transport, we are committed to the highest level of transparency. We provide you with key data about temperature, humidity, O2 and CO2 from inside your reefer container. On top you can track its latest location in near to real-time.
Hapag-Lloyd LIVE DEMO in now available to all customers registered for the Hapag-Lloyd Online Business Suite.
Transparent Data
Get full transparency in your cold chain with real data updated every hour in near real-time without any additional delay.
Seamless Monitoring
Monitor all of your shipments at a glance in our dashboard displaying all the key data regarding your cargo and providing easy access to your data graphs.
Increased Efficiency
Automated data flow with a possibility to receive near-real time alerts to mitigate the risks.
To fit Hapag-Lloyd LIVE to your cargo's needs, we offer different solutions and packages to keep your cargo in pristine condition. You can access the Hapag-Lloyd LIVE data via our Online Business Suite and the Hapag-Lloyd Mobile App or via our API Portal.
You can find the packages and their accessibility below.


Key Features
- Container Overview: when accessing the Hapag-Lloyd LIVE Web App a list of all the Hapag-Lloyd LIVE containers is available. On the main screen users can find key details for each containers at a glance. This includes the shipment number, the container Start Location, Estimated Time of Departure, End Location, Estimated Time of Arrival and the type of Hapag-Lloyd LIVE package assigned to this container.
- Data Graph Panel: displays information related to temperature (in Hapag-Lloyd LIVE Basic package) and additional data graphs with the information on Cold Treatment (USDA probes), Controlled Atmosphere (CO2 and O2 parameters) and Relative Humidity – available for Hapag-Lloyd LIVE Plus bookings.

- The Power-Off Tab with a summery of all the reefer off power periods, while highlighting the individual and overall duration of power-off events, the start & end time and associated container movement events.
- The Map Tab provides an overview for the GPS data. You can monitor the full journey of your Hapag-Lloyd LIVE reefer container in a single click. Additionally, this feature makes it possible to check the associated container movement event (e.g. Gated out Empty) and data readings at any part of the journey are available upon clicking the info points.
- The Automated Data Report feature enables you to configure automated data report generation that is triggered upon container discharge at the port of destination, with reports delivered directly to your email addresses.
- Alerts configured via Hapag-Lloyd LIVE Notifications enable you to proactively manage your shipments. You can choose to be informed with near real-time reefer alerts via email when specific reefer data points fall outside expected ranges.
For further information please get in touch with your nearest Hapag-Lloyd Sales office or contact our Hapag-Lloyd LIVE helpdesk under: [email protected]
Don't Miss Our Latest Updates and Sign up for Our Newsletters.


