Below you find all financial announcements since the issuance of our corporate bonds in October 2010. To view all press releases by Hapag-Lloyd please visit the press section.
Back to 2011
Hapag-Lloyd emerged strengthened out of the crisis: record year in 2010 in terms of profitability
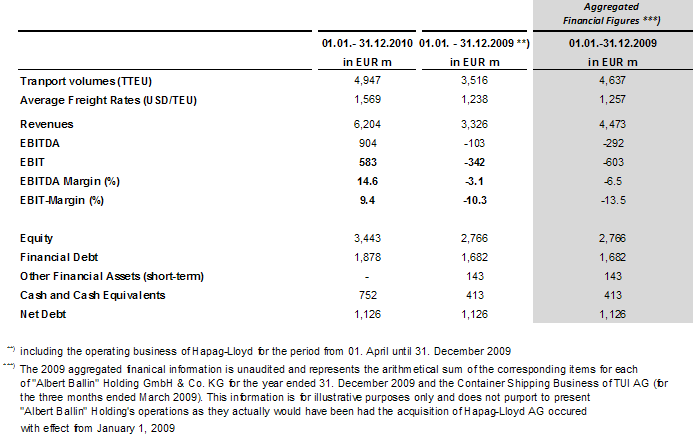
Hapag-Lloyd achieved a transport volume of 4,947,000 TEU in 2010. Revenues climbed to 6,2 million euro and operating profits (EBIT) reached 583 million euro.
- Impressive turn around due to consequent measures and strong recovery of the global economy
- Strong increase in volumes and freight rates
- Revenues increase about 39% to EUR 6.2 bn, EBIT of EUR 583 m.
Hapag-Lloyd was able to capitalize on the positive industry dynamics, leading to a record year in terms of profitability. The overall positive performance was supported by a stronger than expected recovery in global economy and world trade and an overall positive business environment in 2010.
Significant increase of worldwide transport volumes
Hapag-Lloyd achieved a total transport volume of 4,947 TTEU in 2010 – representing a 7% increase from the aggregated volumes in 2009* due to positive volume momentum on all major trade lanes. Transport volumes on the Atlantic trade increased by 8% to 1,137 TTEU compared to last year. The Latin America trade increased by 18% to 1,079 TTEU over the same period. On the Far East trade, Hapag-Lloyd recorded a transport volume increase to 1,112 TTEU, 6% higher than previous year’s level. Volumes on the Transpacific trade increased by 11% to 1,087 TTEU over the same period. Transport volumes on the Austral-Asian trade decreased by 18% to 532 TTEU as the company decided not to accept unprofitable business in order to sustain margins on that trade.
Significant recovery of freight rates
Average freight rates showed a strong recovery from low levels in 2009. Following a drop in average freight rate in 2009* by 21% compared to 2008, Hapag-Lloyd recorded an increase of 25% resulting in an average freight rate of 1,569 USD/TEU in 2010.
Impressive turn around in terms of financial performance
In the fiscal year 2010, revenues of the Group increased to EUR 6,204 million which represents an increase of 39% compared to 2009*. Operating earnings before interest and taxes (EBIT) increased to EUR 583 million, resulting in an EBIT margin of 9.4%. The year before, the company had to record a loss of EUR 603 million*. Operating earnings before depreciation and amortization (EBITDA) totalled EUR 904 million in 2010 equalling a margin of 14.6%.
“Hapag-Lloyd’s record financial performance in the fiscal year 2010 is a clear indication of the ability to capitalize on the positive industry dynamics. As a result of the strong operational performance in combination with the joint effort of all Group staff, the company emerged strengthened from the 2009 crisis”, said Michael Behrendt, CEO of Hapag-Lloyd.
Supported by the positive operating cash flow as well as financing measures taken in 2010, Hapag-Lloyd was able to increase its cash position by EUR 339 million to a level of around EUR 752 million by the end of 2010. Net debt (financial debt less cash position and other financial assets) was EUR 1,126 million as of December 31, 2010. Due to the good operating performance, the leverage ratio (net debt to EBITDA) was 1.2x as of
December 31, 2010.
As of December 31, 2010, equity of the Group was EUR 3,443 million, compared to EUR 2,766 million as of December 31, 2009, corresponding to an equity ratio of 52%.
Hapag-Lloyd will publish its annual report for the fiscal year 2010 with audited group financial statements on March 18, 2011.
*) The information for the fiscal year 2010 refers to the published preliminary unaudited IFRS consolidated financial statements of “Albert Ballin” Holding GmbH & Co. KG, where Hapag-Lloyd represents the major part of the group. As the audited comparable information for the year 2009 includes the operating business of Hapag-Lloyd for a nine months period due to the first time consolidation of Hapag-Lloyd as of March 31, 2009, the here presented figures for 2010 are compared with the aggregated financial figures covering the full year 2009 for illustrative purposes only and are neither audited IFRS nor proforma financial figures.
Selected Financial Information (preliminary unaudited)
NOT FOR RELEASE, PUBLICATION OR DISTRIBUTION, DIRECTLY OR INDIRECTLY, IN OR INTO THE UNITED STATES, AUSTRALIA, CANADA OR JAPAN.

Hapag-Lloyd Apps
© Hapag-Lloyd AG